Recent Update: One month later, after we opened our issue #10264, it turns out that the gVisor developers are also aware of tha lacking of documentation about the
systemd-cgroupoption. Finally:
- They have added the
systemd-cgroupoption to the documentation in 8c3abba, although the documentation website doesn’t seem to be updated as of now.runscwill throw a warning if it detects a systemd-like path butsystemd-cgroupis not used to tell you about the possible misconfiguration.So if you are using gVisor with systemd cgroup, you should add the
systemd-cgroupoption to therunscconfiguration, if not already.
The Problem
Recently we found some of our Kubernetes nodes were constant going down, completely dead, with no luck connecting to it. Taints like node.kubernetes.io/unreachable:NoSchedule and node.kubernetes.io/unreachable:NoExecute were automatically added to the nodes because the kubelet was not able to communicate with the API server. The only way to bring the node back was to restart it. After some debugging, we found out that some bad gVisor-created (runsc runtime) Pods was eating all the memory of the node and killing it. Traditional Pods with runc runtime were running fine.
You may say, “But there are memory limit on a Pod. If it uses more than the limit it should be killed by the OOM killer, right”? That’s what I thought too, so I applied the following Deployment to intentionally consume some memory and see if it will be killed.
Click to see full yaml
| |
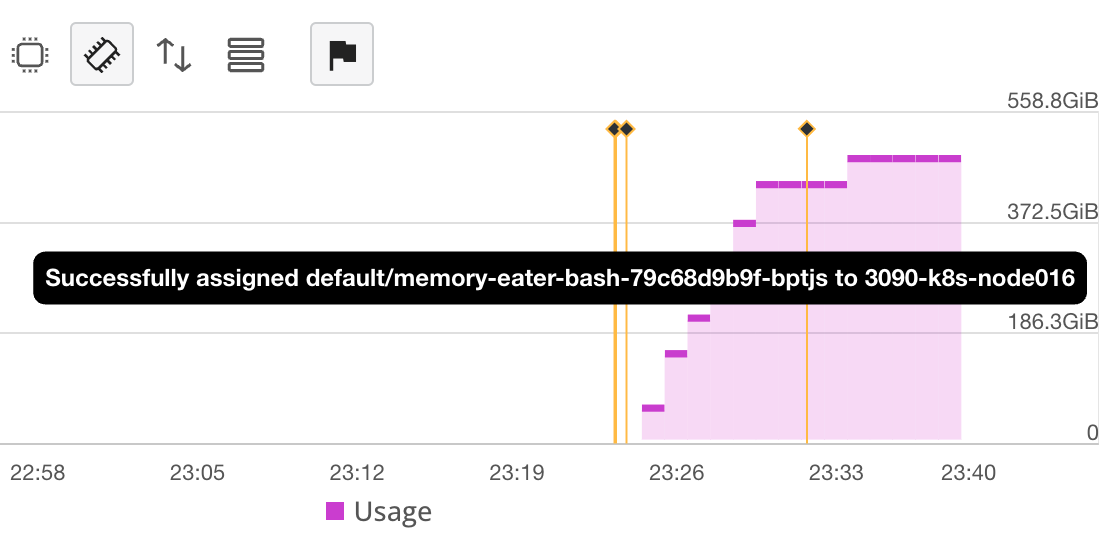
I applied 256MiB memory limit on it, hoping it will be kill after it uses more than 256MiB memory. But it didn’t. It kept eating all the memory until the node was dead, bypass OOM protection provided by Kubernetes. It ate over 500GiB of memory, which is the total memory of the node, and we were no longer able to connect to the node. Luckily, we eviction process kicked in and existing Pods on the node are moved to other nodes, so the service was not affected by much.
The Debug Process
Of course, we need to apply the above memory-eater Deployment to reproduce the issue. But killing a node every time is not a good idea 😂 , especially when we need to manually restart it. So I used another Deployment to consume some (1GiB) memory, but not all of it.
Click to see full yaml
| |
Just as I expected, the memory limit did not work. Time to debug.
Trying to reproduce
Before I trying to do anything on the production cluster, I tried to reproduce the issue on my local machine. Just to be safe not to kill the production cluster and get fired :P (just kidding. It’s because debugging is a lot easier on my local machine).
I used Docker with gVisor as per the official documentation. It was working fine. Our production cluster is using containerd, so was it a containerd issue? I was in a hurry so I used minikube with gVisor addon enabled, which should provide a Kubernetes cluster with containerd and gVisor (and a containerd shim for runsc). At the time of writing, it was Kubernetes v1.28.3, containerd v1.6.24, and gVisor release-20240401.0.
I know, I know. We should keep versions of the software same as the production cluster. But I was in a hurry and I was not sure if the issue was with
containerdorgVisor. So I just went with it. Spoiler: yes, it has something to do with versions. If I were to do it again, I would use the same versions as the production cluster.
| |
I applied the memory-eater Deployment and waited some surprising results. But the 256MiB memory limit was working as expected. The Pod was killed after it used more than 256MiB memory. I smelled some fishy things going on in the production cluster.
Debugging on the production cluster
Again, I applied the memory-eater Deployment, but on the production cluster this time. Hoping it will not kill the node. To my relief, it did not kill the node. But it did not kill the Pod with its memory (969MiB) above limits (256MiB) either (which is expected).
| |
Before I dig anything deeper (like with some gVisor debugging tools), I checked the sandbox created by runsc (gVisor) to see if there is anything suspicious.
| |
Hmm, something caught my eye.
| |
Why is the total-memory and total-host-memory set to 503GiB? That’s the total memory of the node. I assume it should be set to the memory limit of the Pod, which is 256MiB. To verify my assumption, I checked the sandbox created by runsc on my local machine and it indeed was set to 256MiB.
| |
It has the correct limits on my local machine.
| |
So the issue was with this --total-memory argument. But why is it incorrect on the production cluster?
Checking the versions
Seeing the difference, I checked the versions on my local cluster and the production cluster.
| Tool | Local | Production |
|---|---|---|
| Kubernetes | 1.28.3 | 1.26.2 |
| containerd | v1.6.24 | v1.7.0-rc.1 |
| runsc | 20240401.0 | 20231009.0 |
Both are running Ubuntu Server 22.04 LTS, using systemd+cgroupsv2.
I assume the problem was with runsc (gVisor).
What’s wrong with gVisor?
Cgroups v2 support
After I know the issue is with the --total-memory flag. I found there is a similar issue reported google/gvisor #9580. The author had great explanation of the issue:
Under Kubernetes + cgroups v2 + systemd, gVisor launches all processes into the container subgroup associated with the pause container. This makes some sense given that cgroups v2 specifies that processes can only exist at leaf nodes, and the pod’s cgroup is registered as a slice (an intermediate unit which cannot have its own processes) with systemd. When the sandbox is launched gVisor needs a container subgroup and the pause container is the first to be launched. The pause container is a child of the pod cgroup and therefore inherits the limits of the parent pod cgroup, BUT the child’s controllers reflect the default max value. This in turn means that this code which reads the memory limit and cpu quota reads these as unlimited.
Let me explain a bit more. So a normal cgroup v2 hierarchy for a Pod looks like this:
| |
The pod slice has a memory limit (cat memory.max gives xxx), but the container scope does not (cat memory.max gives max). The container scope is where the container is running. The container scope is a child of the pod slice. So the container should inherit the memory limit of the pod slice. This is how cgroups works.
But gVisor only checks the container scope and says “oh, it has no memory limit. Let’s set the total memory to max (the total memory of the node)”. And that’s why the --total-memory is set to 503GiB on the production cluster.
This issue was fixed in google/gvisor #9631. The code below is from the PR which fixed the issue (after the comments). So it checks the Pos slice (parent) if the memory limit is not set in the container slice (leaf node).
| |
The runsc binary on our production cluster was built before the fix was merged. So I assume the issue was fixed in the runsc binary after the merge.
Systemd cgroup configuration
So if the issue was fixed in the latest release, simply upgrading the runsc binary should fix the issue. No. The issue was still there. I checked the runsc binary on the production cluster and it was built after the fix was merged. So what’s wrong?
Remember what a normal cgroup v2 hierarchy looks like in the previous section? Although the cgroups created by runc are just like that, that’s not how the ones created by runsc looks like on our production cluster. Instead, they look like this:
| |
Why are the container cgroups not under the pod cgroups? Why are they in system.slice? If that was the case, the fix above won’t do anything because the parent slice is not the pod slice. The parent slice is system.slice, it has no memory limit. So the container will have no memory limit even after the fix. OOM’in the node.
After some issue-searching on the gVisor GitHub repo, I found that runsc initially has no support for systemd cgroups google/gvisor #193. Support for systemd cgroup was added in google/gvisor #7287. It required a specific configuration in the runsc configuration:
| |
Hmm, looks like there was nothing like that in the runsc configuration on the production cluster. Go! Fix it! Find one of the cordoned node, drain it, upgrade the runsc binary, and change the configuration.
| |
Restart containerd systemctl restart containerd. Apply a new Pod with toleration and nodeSelector to schedule it to a cordoned node. And it worked! The container cgroups are now under the pod cgroups. The --total-memory is set to 256MiB. The Pod was killed after it used more than 256MiB memory. The node was not killed. The issue was fixed.
Conclusion
So the issue was a combination of old gVisor version and incorrect configuration. The gVisor version on the production cluster was built before the fix was merged. The configuration was missing the systemd-cgroup option. The issue was fixed by upgrading the runsc binary and adding the systemd-cgroup option to the configuration.