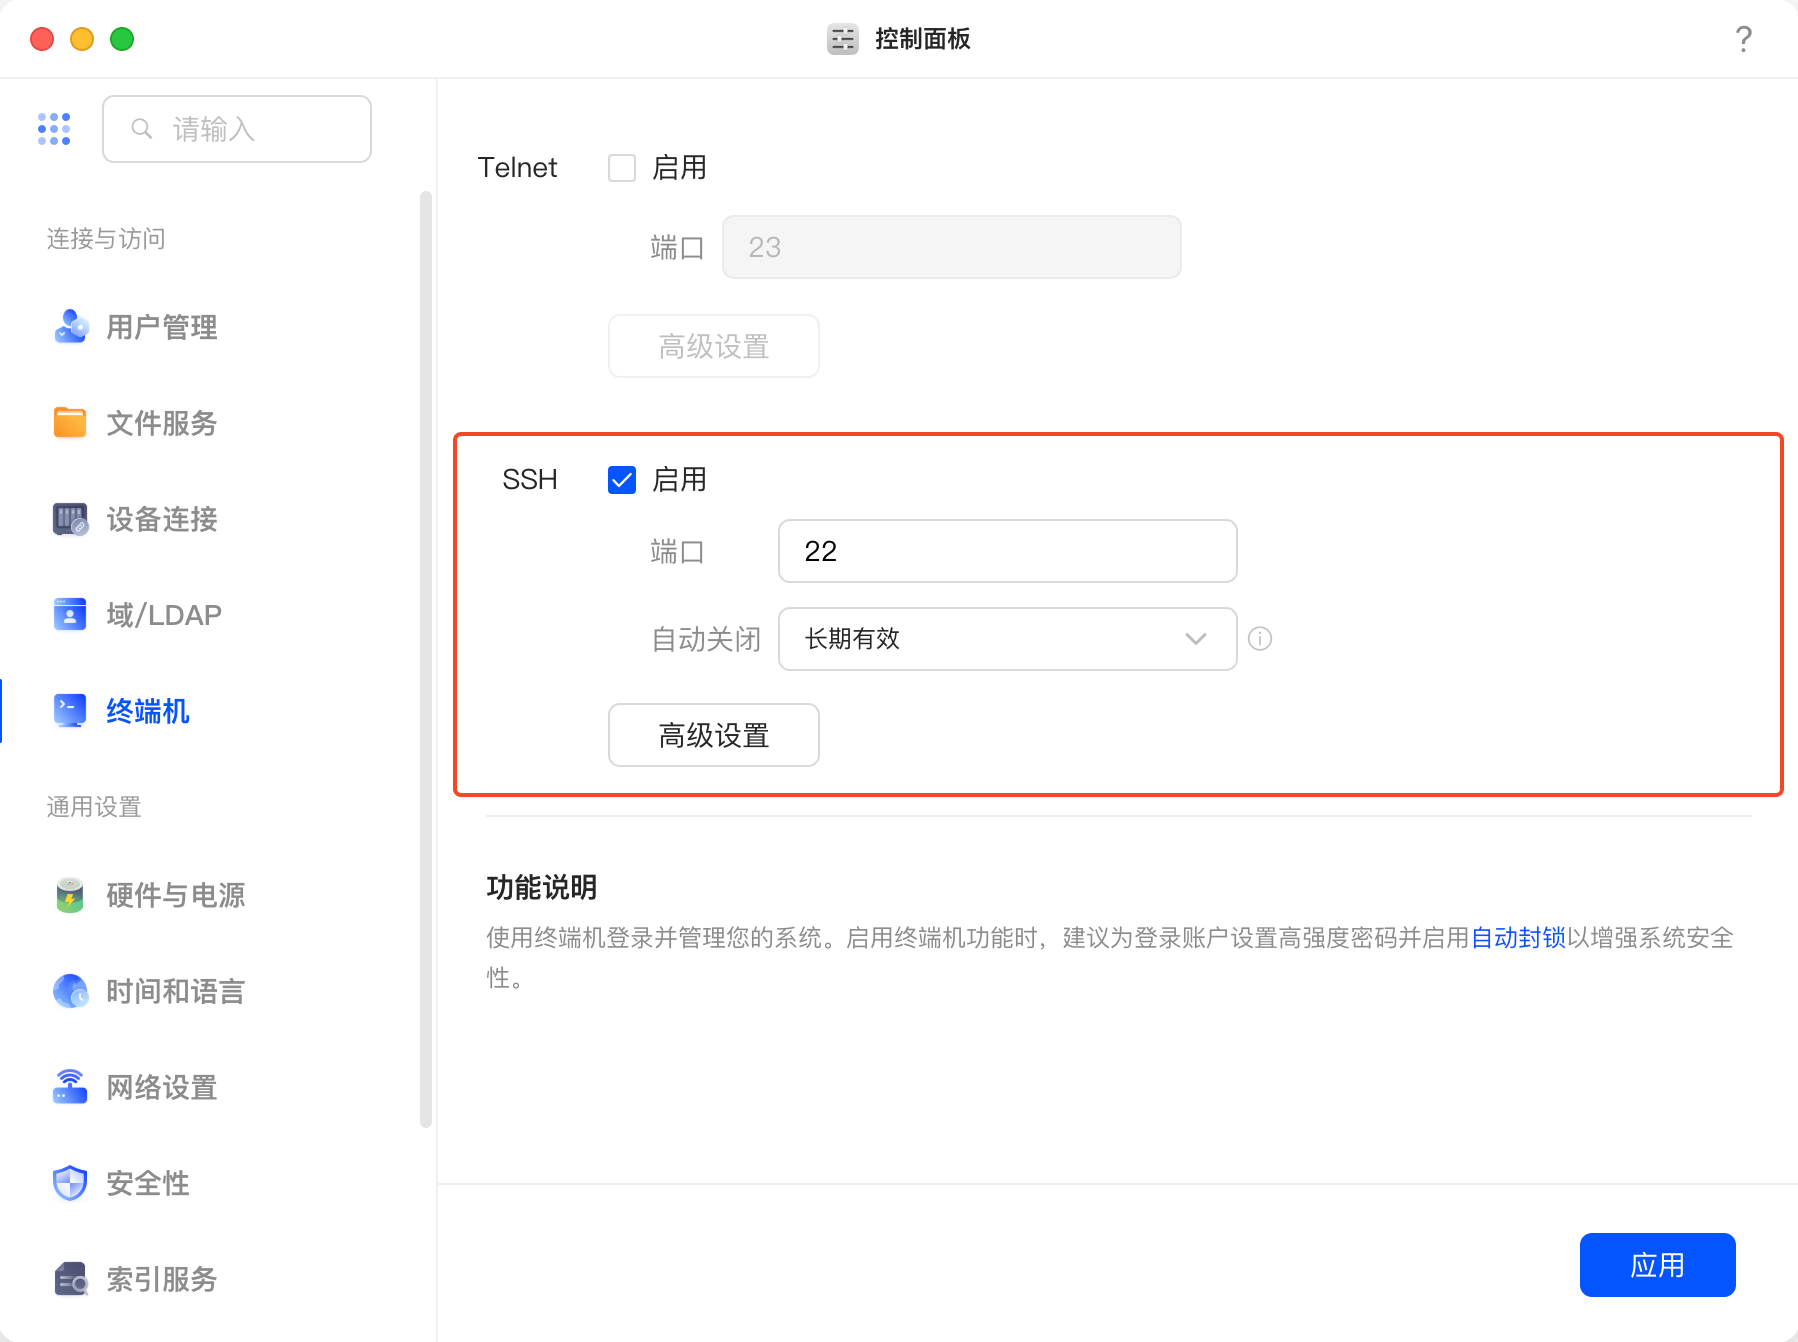
启用 SSH
没SSH就别想着用Terminal了,赶紧去开了。
去绿联NAS的Web管理界面,控制面板 -> 终端机 -> SSH ,记得关闭自动关闭功能。
配置 root 用户 SSH 登录
用你的NAS用户名SSH到NAS上ssh yourname@nas-ip
你需要先有一个SSH密钥对,如果你还没有,可以用 ssh-keygen -t rsa 生成一个。
 1
 2
 3
 4
 5
 6
 7
 8
 9
10
11
12
13
14
15
| # 切root
sudo su
# 打开 root SSH 登录(仅允许密钥登录)
# 注意,别去改 /etc/ssh/sshd_config ,因为绿联NAS的系统会保护这个文件,改了重启就失效了。
echo 'PermitRootLogin prohibit-password' >> /etc/ssh/sshd_config.d/A0-root-login.conf
# 应用修改
systemctl restart ssh
# 将你的公钥添加到 /root/.ssh/authorized_keys 中
mkdir -p /root/.ssh
chmod 700 /root/.ssh
echo 'your-public-key' >> /root/.ssh/authorized_keys
chmod 600 /root/.ssh/authorized_keys
|
配置你本机的 ~/.ssh/config 文件使用对应的密钥登录NAS:
1
2
3
4
| Host nas
HostName nas-ip
User root
IdentityFile ~/.ssh/<private-key>
|
安装包管理器 Opkg
那么有人会问,你为什么要装包管理器,你怎么不用自带的 apt?UGOS Pro不是基于Debian的么?其实最主要的原因是避免干扰内置预装的package。我举个例子,你想安装git,好,那你得apt update吧,update完拉过来了最新的package index,然后刚好这个新的git依赖新版的libcurl,你装的时候给他一起升级了,但是绿联自带了不少预装的package,这些package可能是根据老版本libcurl编译的。正常的debian你upgrade一下就完事了,但是UGOS作为一个定制的Debian,不建议你这么做(其实要是你尝试去upgrade,你会发现不让你upgrade,绿联已经做了保护了,虽然你可以绕过就是)。
OK,我们解释清楚了为什么不用apt。那么用什么呢?我的建议是一个轻量级给嵌入式设备用的包管理器,用OpenWRT的可能很熟悉了,就是opkg。你想重量级一点,也可以用Homebrew/Linuxbrew(不过你得先装git才能装Homebrew,但是git又没有,现在还没包管理器也没得装git,循环依赖了属于是),也可以用Nix(我觉得Nix太重了,除非你真的需要Nix的特性,不然就算了)。
这里用 Opkg 做演示。你需要用root用户SSH到NAS上ssh root@nas-ip。
 1
 2
 3
 4
 5
 6
 7
 8
 9
10
11
12
13
14
| # 下载 opkg 安装脚本
wget https://mirrors.nju.edu.cn/entware/x64-k3.2/installer/generic.sh -O opkg-install.sh
# 换源 1
sed -i 's|http://bin.entware.net|https://mirrors.nju.edu.cn/entware|g' opkg-install.sh
# 换源 2
sed -i 's|-O /opt/etc/opkg.conf|-O /opt/etc/opkg.conf \&\& sed -i "s,http://bin.entware.net,https://mirrors.nju.edu.cn/entware,g" /opt/etc/opkg.conf|g' opkg-install.sh
# 执行 opkg 安装脚本
/bin/sh opkg-install.sh
# 临时设置 PATH ,使得 opkg 命令可用
export PATH=/opt/bin:/opt/sbin:/opt/usr/bin:$PATH
# 设置 PATH ,使得 opkg 命令可用。如果你用 zsh,记得改成 ~/.zshrc 。
# 或者如果你用我的 dotfiles,现在可以先不做这一步,你可以看后续我配置 zsh 的时候怎么做的。
echo 'export PATH=/opt/bin:/opt/sbin:/opt/usr/bin:$PATH' >> ~/.bashrc
|
安装常用Package
这时有包管理器了,而且是与NAS系统隔离的,你可以随意安装了。以下是一些常用的包:
1
2
3
4
5
6
| # 注意 vim 需要安装两个包,vim-full 和 vim-runtime
opkg install vim-full vim-runtime
# 终于能装 git 了,注意需要 git-http
opkg install git git-http
# 其他常见工具
opkg install htop sysstat zsh
|
配置 ZSH
如果你想要一个更好的终端体验,建议使用 ZSH 和比较好的配置。以下是使用我的 dotfiles 来配置 ZSH 的步骤:
注意,你需要在你以后会经常使用的用户中配置 ZSH 。
我这里都是用的 root 用户,我对 Linux 比较熟悉了所以我并不怕搞坏东西。
如果你不熟悉 Linux,建议切换回自己用户配置 ZSH 。
如果找不到 git ,记得参考 opkg 安装中最后一步重新设置 PATH 。
 1
 2
 3
 4
 5
 6
 7
 8
 9
10
| # 先设置代理,等会要从 GitHub 上下载文件
export https_proxy=http://<your-proxy-ip>:<your-proxy-port>
# 克隆我的 dotfiles 仓库
cd
git clone https://github.com/charlie0129/dotfiles.git
cd dotfiles
./bootstrap.sh -f
zsh
# 询问 Do you need to use a proxy [y/n] 的时候选择 n (因为前面 set 过 proxy 了)
# 询问 Change login shell of root to /opt/bin/zsh 的时候选择 y (不然呢)
|
将 Opkg 的 bin 和 sbin 目录添加到 ZSH 的 PATH 中:
1
| vim ~/dotfiles/env/custom.sh
|
1
2
3
4
5
6
7
8
9
| # This list is inserted before PATH
PATH_BEFORE=(
# custom bin in this repo, i.e. bin/custom
$HOME/dotfiles/bin/custom
# Opkg bin and sbin directories
/opt/bin
/opt/sbin
/opt/usr/bin
)
|
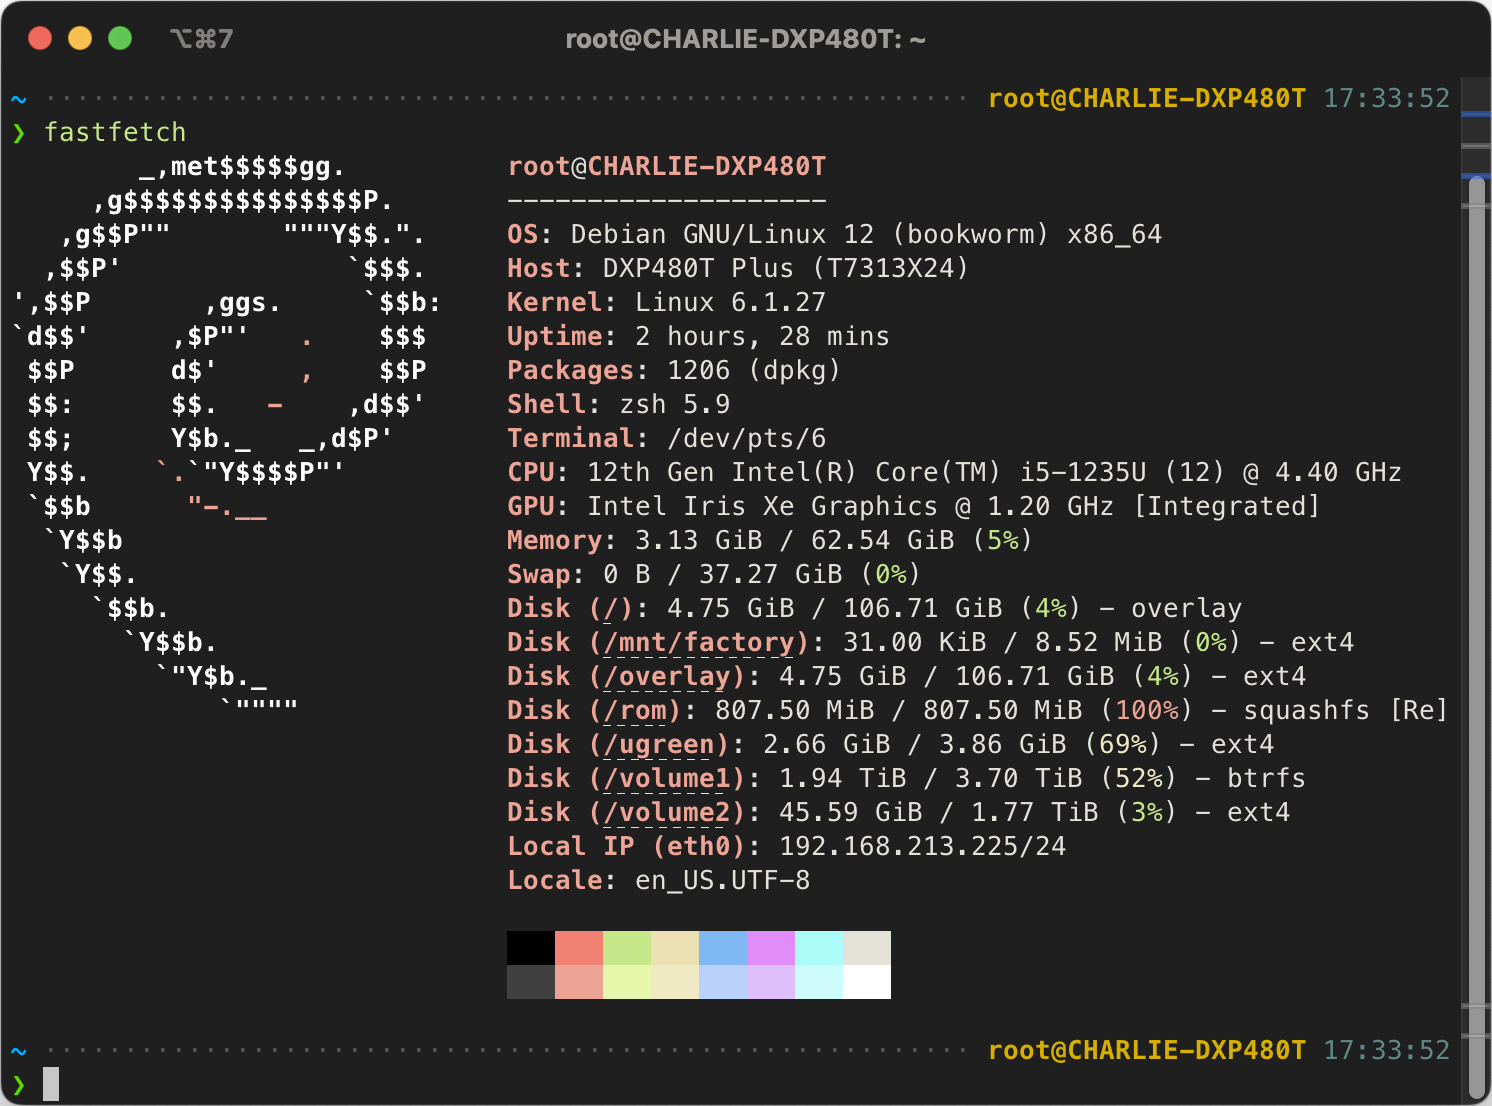
效果
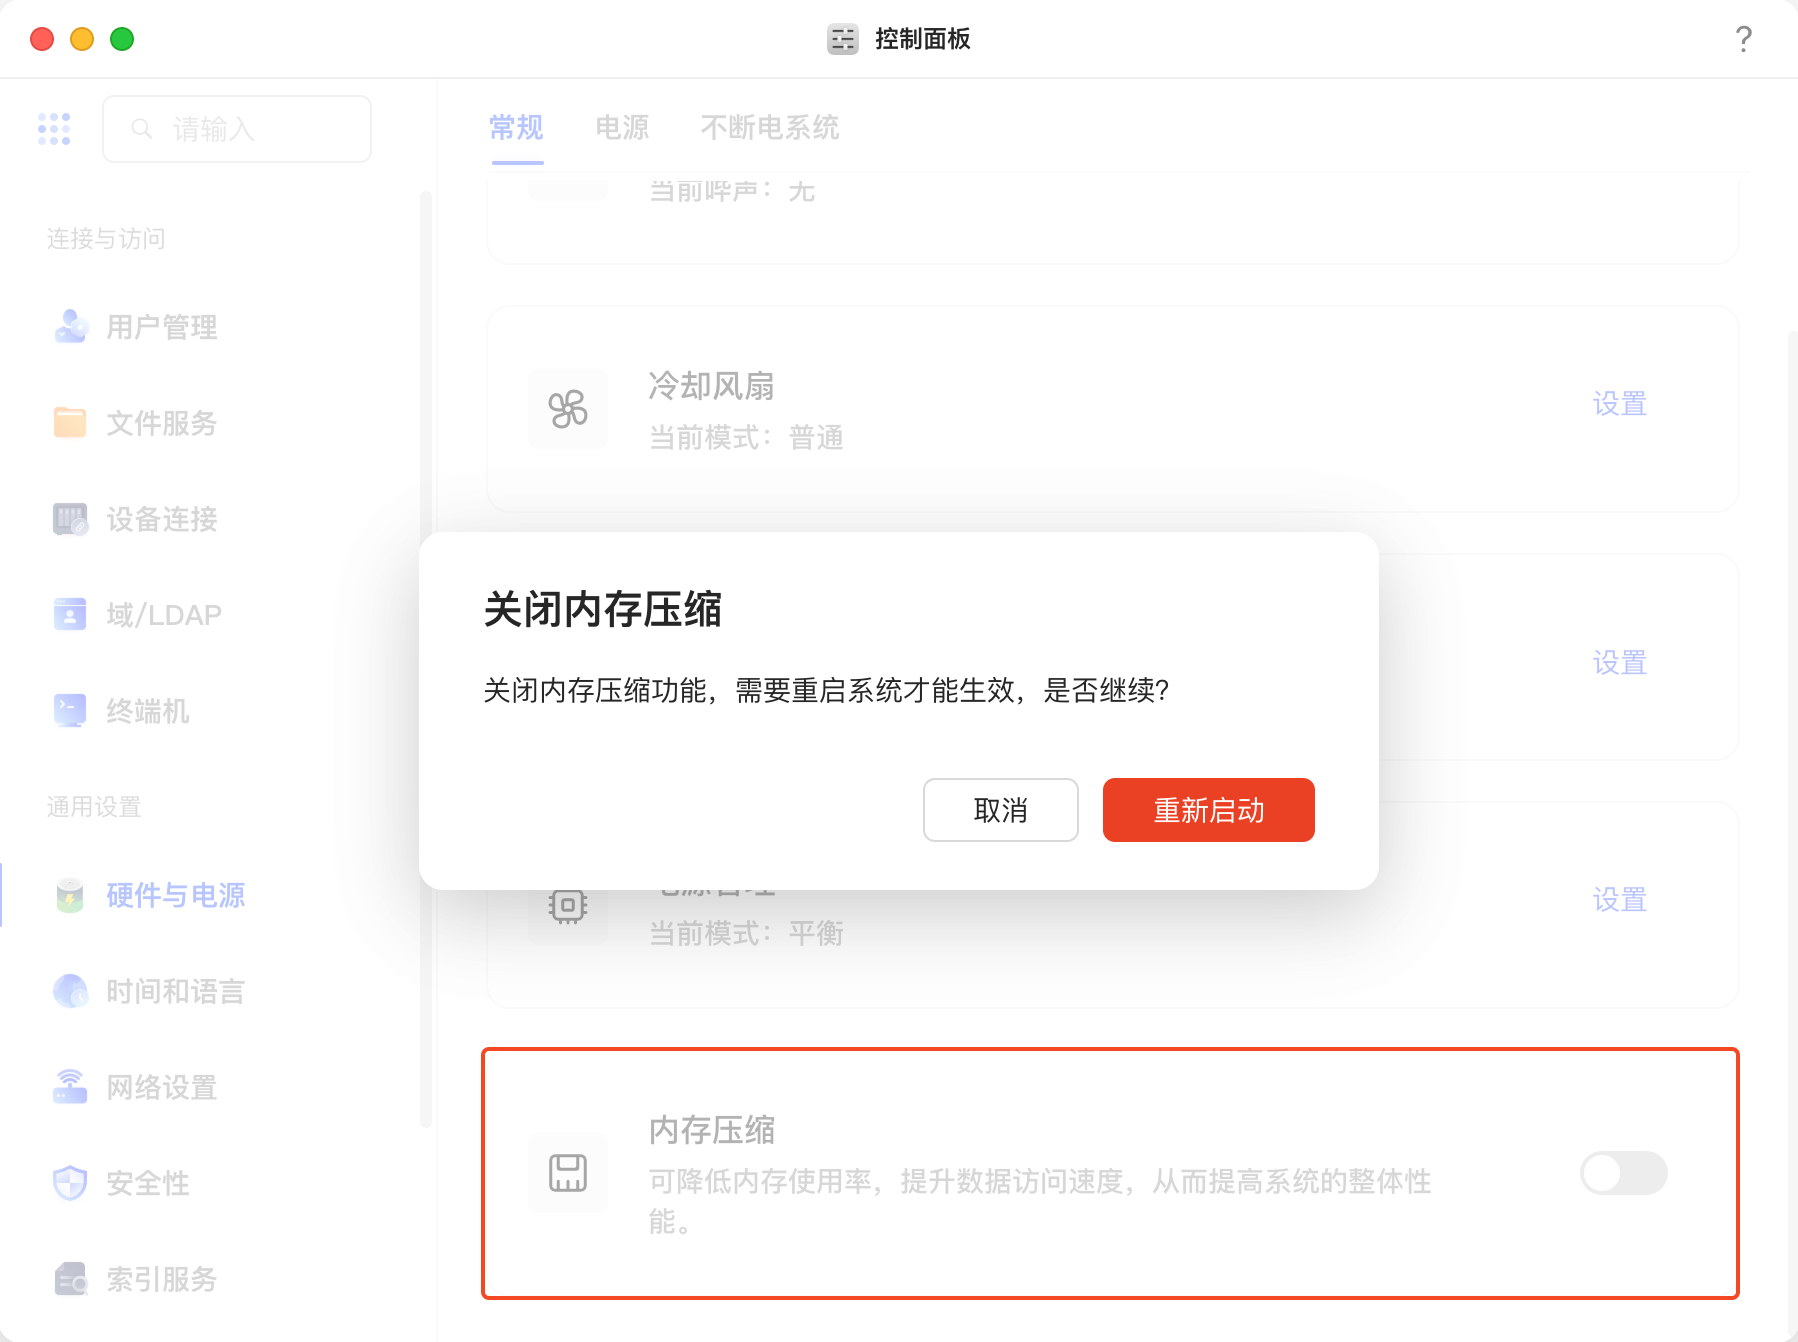
优化 Zram
需要使用 root 用户
绿联默认的 zram 不够激进,关了它。我们要用 zstd 算法和一半的内存来做zram,榨干内存。
1
2
3
4
5
6
7
| # 先设置代理,等会要从 GitHub 上下载文件
export https_proxy=http://<your-proxy-ip>:<your-proxy-port>
git clone --depth=1 https://github.com/foundObjects/zram-swap.git
cd zram-swap
./install.sh
cd ..
rm -rf zram-swap
|
配置使用 zstd 算法(因为 Debian 13 里面默认 zram 不给 lzo-rle 算法了,lz4 的压缩率又不行,所以用 zstd ):
1
2
| sed -i 's/_zram_algorithm=.*/_zram_algorithm="zstd"/g' /etc/default/zram-swap
systemctl restart zram-swap
|
为 zram 配置合适的 sysctl ,较大的 swappiness 值可以不活跃的页面更快地被交换出去,让内存留给更有用的页面。因为 sysctl.conf 里面绿联已经设置了 vm.swappiness 如果放在 /etc/sysctl.d/ 里面会被覆盖掉,所以直接放在 sysctl.conf 里面。
1
2
3
4
5
6
7
| echo '# ZRAM BEGIN' >> /etc/sysctl.conf
echo 'vm.swappiness = 180' >> /etc/sysctl.conf
echo 'vm.watermark_boost_factor = 0' >> /etc/sysctl.conf
echo 'vm.watermark_scale_factor = 125' >> /etc/sysctl.conf
echo 'vm.page-cluster = 0' >> /etc/sysctl.conf
echo '# ZRAM END' >> /etc/sysctl.conf
sysctl --system
|
能看到内存大小 1.5 倍的zram swap即成功
1
2
3
| $ swapon
NAME TYPE SIZE USED PRIO
/dev/zram0 partition 93.8G 0B 15
|
安装 Docker
先去应用中心安装 Docker 。默认绿联的Docker 配置比较烂,而且还会在根目录下留下一个 /daemon.json 的文件夹(WTF?),一看就是绿联的安装脚本写错了。
1
2
| # 删除错误的 daemon.json 文件夹
rmdir /daemon.json
|
将以下json写入 /etc/docker/daemon.json:
 1
 2
 3
 4
 5
 6
 7
 8
 9
10
11
12
| {
"log-opts": {
"max-size": "1m"
},
"experimental": true,
"metrics-addr": "0.0.0.0:8132",
"storage-driver": "overlay2",
"data-root": "<your-data-root>",
"registry-mirrors": [
"https://xxxxxx.com/dockerhub/",
]
}
|
log-opts:限制日志大小,防止日志占满磁盘。experimental:启用实验性功能。metrics-addr:设置可观测端口。storage-driver:使用 overlay2 存储驱动。data-root:设置 Docker 数据目录,建议查看你之前的 /etc/docker/daemon.json 中的配置,不要动。registry-mirrors:设置 Docker 镜像加速器,建议使用国内的镜像源。
可观测配置
- Grafana: 用于可视化和监控。
- Victoria Metrics: 用于指标存储与查询。
- Alloy: 用于容器日志采集。
- Cadvisor: 用于容器指标采集。
- Loki: 用于日志存储与查询。
- Node Exporter: 用于主机指标采集。
- Smartctl Exporter: 用于硬盘SMART指标采集。
- Intel PCM: 用于CPU性能监控。
效果:TODO
参考 Docker Compose (镜像版本可以适当升级,记得更换volume中数据存储位置):
  1
  2
  3
  4
  5
  6
  7
  8
  9
 10
 11
 12
 13
 14
 15
 16
 17
 18
 19
 20
 21
 22
 23
 24
 25
 26
 27
 28
 29
 30
 31
 32
 33
 34
 35
 36
 37
 38
 39
 40
 41
 42
 43
 44
 45
 46
 47
 48
 49
 50
 51
 52
 53
 54
 55
 56
 57
 58
 59
 60
 61
 62
 63
 64
 65
 66
 67
 68
 69
 70
 71
 72
 73
 74
 75
 76
 77
 78
 79
 80
 81
 82
 83
 84
 85
 86
 87
 88
 89
 90
 91
 92
 93
 94
 95
 96
 97
 98
 99
100
101
102
103
104
105
106
107
108
109
110
111
112
113
114
115
116
117
118
119
120
121
122
123
124
125
126
127
128
129
130
131
132
133
134
135
136
137
138
139
140
141
142
143
144
145
146
147
148
149
150
151
152
153
154
155
156
157
158
159
160
161
162
163
164
165
166
167
168
169
170
171
172
173
| name: o11y
services:
grafana:
container_name: grafana
image: grafana/grafana:12.1.0
restart: unless-stopped
mem_limit: 1G
user: 0:0
networks:
- o11y
# 我使用了 Traefik 作为反向代理,所以不需要暴露端口
# 如果你没有使用 Traefik,可以取消注释以下端口映射
# ports:
# - 3000:3000
healthcheck:
test: wget --no-verbose --tries=1 --spider http://localhost:3000/api/health
volumes:
- /volume2/docker/data/grafana:/var/lib/grafana
environment:
TZ: Asia/Shanghai
GF_SERVER_ENABLE_GZIP: true
# 如果你使用 Traefik 作为反向代理,可以添加以下标签
labels:
- "traefik.enable=true"
- "traefik.http.routers.grafana.entrypoints=web"
- "traefik.http.routers.grafana.rule=Host(`grafana.example.com`)"
- "traefik.http.routers.grafana.service=grafana-secure"
# - "traefik.http.routers.grafana.middlewares=grafana-https-redirect"
# - "traefik.http.middlewares.grafana-https-redirect.redirectscheme.scheme=https"
- "traefik.http.routers.grafana-secure.tls=true"
- "traefik.http.routers.grafana-secure.tls.certresolver=cloudflare"
- "traefik.http.routers.grafana-secure.entrypoints=websecure"
- "traefik.http.routers.grafana-secure.rule=Host(`grafana.example.com`)"
- "traefik.http.services.grafana-secure.loadbalancer.server.port=3000"
vm:
container_name: vm
image: victoriametrics/victoria-metrics:v1.122.0
restart: unless-stopped
mem_limit: 4G
user: 0:0
networks:
- o11y
# ports:
# - 8428:8428
healthcheck:
test: wget --no-verbose --tries=1 --spider http://localhost:8428/ || exit 1
command:
- -httpListenAddr=0.0.0.0:8428
- -promscrape.config=/etc/victoriametrics/scrape.yml
- -storageDataPath=/var/victoriametrics
- -retentionPeriod=20y
- -inmemoryDataFlushInterval=300s # 减少写盘
extra_hosts:
- 'host.docker.internal:host-gateway'
- 'd48t:host-gateway'
volumes:
- ./vm:/etc/victoriametrics # Scrape 配置
- /volume2/docker/data/vm:/var/victoriametrics
alloy:
container_name: alloy
image: grafana/alloy:v1.10.0
restart: unless-stopped
user: 0:0
networks:
- o11y
mem_limit: 512M
# ports:
# - 12345:12345
command:
- run
- --disable-reporting
- --server.http.listen-addr=0.0.0.0:12345
- --storage.path=/var/lib/alloy/data
- /etc/alloy/config.alloy
volumes:
- /var/run/docker.sock:/var/run/docker.sock:ro
- /tmp/alloy:/var/lib/alloy/data # 这玩意巨能写,SSD会写爆,给他放内存里去。绿联的 /tmp 是内存盘。
- ./alloy/config.alloy:/etc/alloy/config.alloy
cadvisor:
container_name: cadvisor
image: gcr.io/cadvisor/cadvisor:v0.53.0
mem_limit: 256M
restart: unless-stopped
user: 0:0
# ports:
# - 8080:8080
networks:
- o11y
volumes:
- /:/rootfs:ro
- /var/run:/var/run:ro
- /sys:/sys:ro
- /var/lib/docker/:/var/lib/docker:ro
- /dev/disk/:/dev/disk:ro
privileged: true
devices:
- /dev/kmsg
command:
- --store_container_labels=false
- --docker_only=true
- --housekeeping_interval=30s
loki:
container_name: loki
image: grafana/loki:3.5.3
restart: unless-stopped
user: 0:0
networks:
o11y:
ipv4_address: "172.26.195.254" # 固定 IP,方便 Docker 的 Loki plugin 用(虽然我们这里用的 Alloy 其实并不需要)
# 如果你没有使用 Traefik 作为反向代理,可以取消注释以下端口映射。
# ports:
# - 3100:3100
mem_limit: 4G
command:
- "-config.file=/etc/loki/config.yml"
volumes:
- ./loki:/etc/loki:ro
- /volume2/docker/data/loki:/loki
node-exporter:
container_name: node-exporter
image: prom/node-exporter:v1.9.1
restart: unless-stopped
mem_limit: 256M
user: 0:0
privileged: true
# ports:
# - 9100:9100
command:
- --path.rootfs=/host
- --web.listen-address=172.17.0.1:9100
network_mode: host
# networks:
# - o11y
pid: host
volumes:
- '/:/host:ro,rslave'
smartctl-exporter:
container_name: smartctl-exporter
image: prometheuscommunity/smartctl-exporter:v0.14.0
restart: unless-stopped
mem_limit: 512M
user: 0:0
# ports:
# - 192.168.91.1:9633:9633
networks:
- o11y
privileged: true
pcm:
container_name: pcm
image: opcm/pcm
mem_limit: 256M
restart: unless-stopped
user: 0:0
privileged: true
# ports:
# - 192.168.91.1:9738:9738
networks:
- o11y
networks:
o11y:
name: o11y
driver: bridge
ipam:
config:
- subnet: "172.26.195.0/24"
|
参考 Victoria Metrics 的 Scrape 配置:
 1
 2
 3
 4
 5
 6
 7
 8
 9
10
11
12
13
14
15
16
17
18
19
20
21
22
23
24
25
26
27
28
29
30
31
32
33
34
35
36
37
38
| # ./vm/scrape.yml
global:
scrape_interval: 15s
scrape_configs:
- job_name: victoria-metrics
static_configs:
- targets:
- vm:8428
# 如果你有 Traefik
# - job_name: traefik
# static_configs:
# - targets:
# - traefik:8082
- job_name: node-exporter
static_configs:
- targets:
- d48t:9100
- job_name: cadvisor
static_configs:
- targets:
- cadvisor:8080
- job_name: loki
static_configs:
- targets:
- loki:3100
- job_name: grafana
static_configs:
- targets:
- grafana:3000
- job_name: smartctl-exporter
static_configs:
- targets:
- smartctl-exporter:9633
- job_name: pcm
static_configs:
- targets:
- pcm:9738
|
参考 Loki 配置:
 1
 2
 3
 4
 5
 6
 7
 8
 9
10
11
12
13
14
15
16
17
18
19
20
21
22
23
24
25
26
27
28
29
30
31
32
33
34
35
36
37
38
39
40
| # ./loki/config.yml
auth_enabled: false
server:
http_listen_port: 3100
common:
instance_addr: 127.0.0.1
path_prefix: /loki
storage:
filesystem:
chunks_directory: /loki/chunks
rules_directory: /loki/rules
replication_factor: 1
ring:
kvstore:
store: inmemory
ingester:
chunk_encoding: lz4 # 比默认的snappy压缩率高
chunk_target_size: 8388608 # 8M
max_chunk_age: 48h
chunk_idle_period: 12h
limits_config:
max_query_lookback: 672h # 28 days
retention_period: 672h # 28 days
schema_config:
configs:
- from: 2020-10-24
store: tsdb
object_store: filesystem
schema: v13
index:
prefix: index_
period: 24h
ruler:
alertmanager_url: http://localhost:9093
|
参考 Grafana Alloy 配置:
 1
 2
 3
 4
 5
 6
 7
 8
 9
10
11
12
13
14
15
16
17
18
19
20
21
22
23
24
25
26
27
28
29
30
31
32
33
34
35
36
37
38
39
40
41
42
43
44
45
46
47
48
49
50
51
52
53
54
55
56
57
| # ./alloy/config.alloy
logging {
level = "info"
format = "logfmt"
}
// Discover Docker containers and extract metadata.
discovery.docker "logs_integrations_docker" {
host = "unix:///var/run/docker.sock"
refresh_interval = "5s"
}
// Define a relabeling rule to create a service name from the container name.
discovery.relabel "logs_integrations_docker" {
targets = []
rule {
target_label = "job"
replacement = "integrations/docker"
}
rule {
target_label = "instance"
replacement = "d48t" // constants.hostname
}
rule {
source_labels = ["__meta_docker_container_name"]
regex = "/(.*)"
target_label = "container"
}
rule {
source_labels = ["__meta_docker_container_log_stream"]
target_label = "stream"
}
}
// Configure a loki.source.docker component to collect logs from Docker containers.
loki.source.docker "logs_integrations_docker" {
host = "unix:///var/run/docker.sock"
targets = discovery.docker.logs_integrations_docker.targets
relabel_rules = discovery.relabel.logs_integrations_docker.rules
forward_to = [loki.write.local.receiver]
refresh_interval = "15s"
}
loki.write "local" {
endpoint {
url = "http://loki:3100/loki/api/v1/push"
}
}
|